“The network is slow” - Sound like something you’ve heard before? What does ‘slow’ mean anyway? And is it different from yesterday? Sometimes tracking down network ‘slowness’ can be pretty difficult, especially when you don’t have a good baseline of what is normal. This kind of goes back to one of the tips I shared earlier in ‘A Little Bit of Magic’ - having a baseline and understanding of what is normal on your network will help you find issues much more quickly.
When I started working for a cloud service provider a few years ago, the first thing to start coming up extremely often is network latency and performance issues. These are things I never had to worry too much about previously, as most of my jobs had been with enterprise environments where everyone is on the same LAN (or at least within one state). However, when you get into hosting a Software-as-a-Service cloud on a global scale, then slight performance issues begin to mean big slowdowns for your customers.
I was amazed at the current network infrastructure monitoring that was in place when I began working for the SaaS provider: A few bare-bones Cacti instances, completely unmanaged by anyone, and not configured to monitor any relevant ports or data. Today that situation is vastly different - I have installed a few different applications that allow us to get alerted on network variances and quickly determine exactly where the issue is. One of the tools that has helped us get to this point is called SmokePing, which I would like to talk about today.
Setup and Installation
I won’t get into the details of installing SmokePing, as there are already a number of good tutorials out there (like this one or this one). If you have a decent familiarity with Linux, then the process should be fairly straightforward. Keep in mind that your SmokePing graphs will show latency and packet loss between the machine you have SmokePing installed on and the targets you define. So make sure that you plan out where you deploy your SmokePing machine(s) to provide beneficial information.
Once you have SmokePing installed and setup, it’s time to start defining targets to monitor. We have over a dozen points of presence globally, so I’ve installed SmokePing on a single machine in each location. Each instance has ping targets defined for every network segment within it’s own datacenter, network segments in every other datacenter, and some public IP space of every datacenter. So we accomplish latency and packet loss monitoring within the datacenter, across the site-to-site VPNs between each datacenter, and the general internet connections between each datacenter. For certain customers, particularly those who have dedicated MPLS circuits to us, we are also monitoring latency/packet loss to customer endpoints.
SmokePing also supports deployment in a controller/worker configuration, where you have a single primary configuration/management point and several workers to perform testing. I really want to test this out for our environment, but I haven’t quite had the time to dedicate to it. If you’re interested though, you can find the details on that here.
Interpreting the graphs
The graphs created by Smokeping might not seem clear the first time you see them. For example, take a look at this:

This graph is the result of a standard latency test - 20 pings every 5 minutes. So for every step on the graph, SmokePing draws out the range of responses in those 20 pings - shown by the gray ‘smoke’. The darker the gray area, the more pings came back with that response time - and similarly the lighter areas mean that fewer pings had that response time. The solid colored part of the line marks the average response across all 20 pings, and also gives an indication of percentage of packets lost.
So the first thing I would notice about this graph is that the average response time is varying quite significantly between about 15ms and 200ms. In a normal healthy network, you should not expect to see such a drastic change in response times like that - some variation is normal, but not to this extreme. Two other things to note from this graph: The time of each latency jump seems to line up almost every 30 minutes, and towards the end we begin seeing some slight packet loss.
After being informed that there was a performance issue between a few different systems, I opened up SmokePing immediately to start looking for anything that jumped out - like the graph above. In this case, this was a 200Mb dedicated MPLS circuit used only for replication traffic between data centers. Every 30 minutes, a replication job was kicking off and saturating the line for a few minutes - which in turn was causing excessive jumps in latency and some minor packet loss.
As another example:
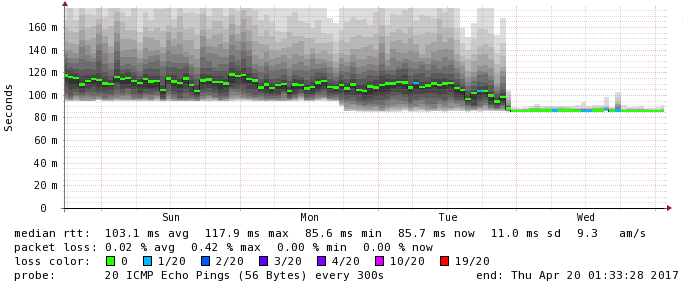
The first thing you probably notice about the graph above is the sudden stabilization of latency. This graph monitors traffic between two data centers over an IPsec VPN tunnel - and we happened to be suspecting that one of the two peer firewalls was having performance issues. We swapped out to new hardware on one side of the connection, and the latency immediately started flat-lining. A consistent 85ms is way better than averaging anywhere from 90-180ms. (And if you happened to notice the slight packet loss after the new device was implemented - that was actually due to an unrelated upstream provider issue). My point with this graph is really just to show how helpful it is to have the historical data available. It would have been extremely difficult to prove that the one firewall was the root cause of our problems if I didn’t have a way to track the issue.
So that’s a bit about SmokePing and how I’ve deployed it within a cloud provider’s environment. It’s only been up and running for a few months, but I’ve already found it to be extremely helpful in troubleshooting performance and latency issues. SmokePing is also extensible via scripting, which can help to collect additional data at the time of an issue. I’ve written a few quick scripts to run extended traceroutes during packet loss events, which I might post up here in the future.
Have you installed SmokePing in your environment? How do you use it? Has it helped you with performance issues?
Comment below!
